
Wednesday, July 7, 2021 the CDC published statistics for Covid-19. The CDC publishes and updates their statistics once a week on Wednesdays. After speaking with a few friends, family and colleagues, it is apparent that there is still a lot of questions by people as to the likelihood of dying from Covid-19. With words like pandemic used early on with the virus, first impressions are difficult to get rid of. In the spirit of information will lead to getting comfortable with moving forward, the California statistical chart is presented by age.
For those of you who are older then 50 years old, it would be good to do an honest assessment of your health to determine you overall health and ability to withstand a Covid-19 infection. Everyone should assess their health and immune system with an eye to getting vaccinated and protecting yourself.
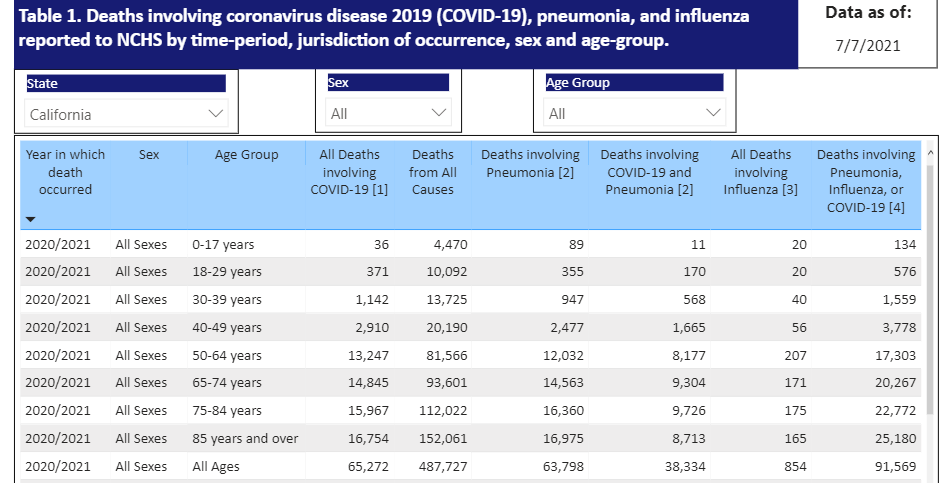
Here is the California death rate by age for Covid-19 as of July 7, 2021.
Age 0 to 17 – 36
18 to 29 – 371
30 to 39 – 1,142
40 to 49 – 2,910
50 to 64 – 13,247
65 to 74 – 14,845
75 to 84 – 15,967
85 and older – 16,754
Total Deaths – 65,272
72.87% of all deaths occurred with people 65 years and over.